Causal artificial intelligence (AI) · Model guide
LWF chain graphs
Lauritzen-Wermuth-Frydenberg (LWF) chain graph
Calculate risk when one system contains both ordered dependencies and groups of mutually associated variables.
Represent finite discrete dependencies with explicitly labeled Lauritzen–Wermuth–Frydenberg chain-graph semantics.
Also known as: LWFChainGraph.
The model in pictures
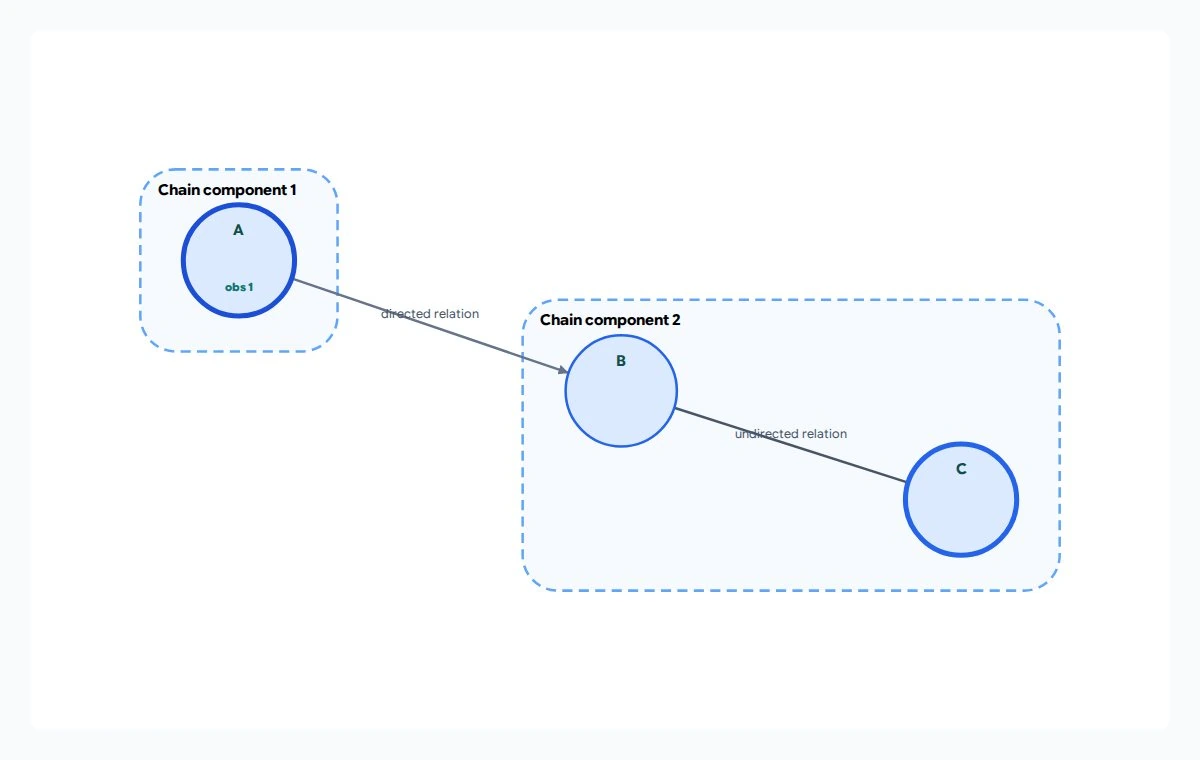
Lauritzen-Wermuth-Frydenberg (LWF) chain graph
A probability network that groups linked variables into blocks, called chain components. It combines undirected relationships inside a block with directed relationships between blocks, using the LWF probability rules.
How does observing an upstream condition change expectations for a linked pair of service indicators?
A points to B, while B and C share a line without an arrow. The dashed outlines group A separately from the coupled pair B and C. This is an association model, not proof of cause and effect. LWF and AMP chain graphs use different independence rules even when their edge shapes match.
Synthetic example, not real patient, customer or operational data.
Variables and symbols
- A
- The upstream operating-condition indicator in this example; its two states are labeled 0 and 1.
- B and C
- The two coupled service indicators, each with states 0 and 1. The fixture does not assign names or good/bad meanings to these states.
- obs 1
- Observation: A has been fixed to state 1 for the probability question.
- AMP
- Andersson-Madigan-Perlman, a different chain-graph interpretation, not another name for LWF.
When to use it
Model service reliability where directed dependencies coexist with coupled component failures.
Applications
- Service reliability: combine dependency stages with coupled component failures.
- Network risk: condition on observed node states under an explicit mixed-edge interpretation.
Why it matters
Conditional probabilities can prioritize investigation, but directed edges in this family do not authorize claims about what an intervention would change.
Questions you can ask
- What is the conditional probability of a service state?
Causal boundary
This family does not expose causal intervention or counterfactual queries. Dependencies, rules, dynamics, and decision actions alone do not establish those semantics.
Profile and resource limits
Finite positive component factors and bounded graph width. Directed edges do not grant interventions; LWF and AMP semantics are distinct.
Online uses protected execution with plan and request limits. Check the returned method, exactness, and resource diagnostics for each query.
Existing workspace example
Coordinated Service Reliability
Inspect a mixed chain graph where an upstream operating condition directs a coupled pair of service indicators. Enter categorical evidence, preserve the undirected relation, and compute exact LWF marginals.
After signing in, open the workspace example gallery and choose this example. Workspace access and actions follow your plan.
Sign in to explore examplesUse it in your application
Released through the native engine and host software development kits (SDKs). Online and SDK resource profiles differ; check the documentation bundled with your exact SDK version.
Read SDK guidance and examples