Causal artificial intelligence (AI) · Model guide
Linear Gaussian models
Put a numerical range around a forecast, then compare how that range moves under a modeled change.
Represent linear relationships between numerical variables with Gaussian disturbances.
Also known as: GaussianSCM, LCG.
The model in pictures
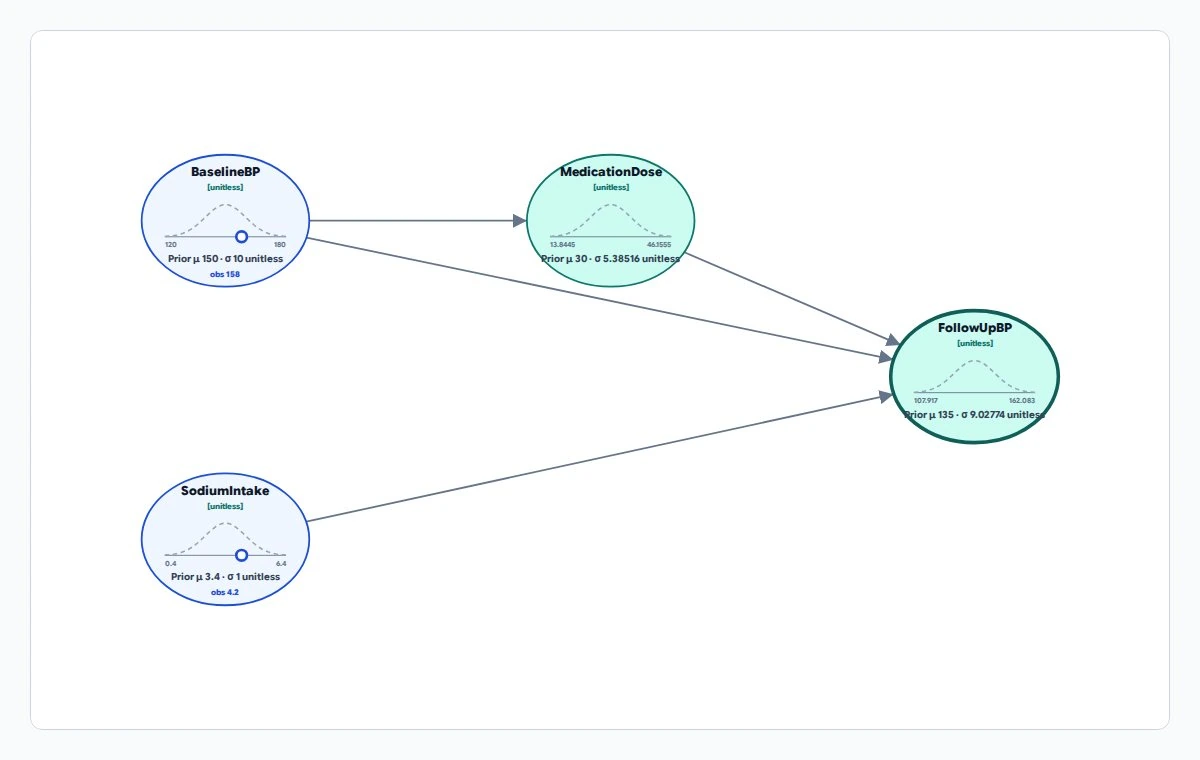
Linear Gaussian model
A model for numeric measurements related by linear equations with bell-shaped, or Gaussian, uncertainty. This example describes assumptions about blood pressure and treatment.
How does expected follow-up blood pressure change under a different medication dose?
Ovals represent numeric variables; the small curves describe their uncertainty. Arrows show the assumed relationships. The display labels the example's values unitless, so the numbers must not be read as clinical doses or thresholds.
Synthetic example, not real patient, customer or operational data.
Variables and symbols
- BaselineBP and FollowUpBP
- BP means blood pressure: the starting systolic pressure and the pressure at follow-up.
- SodiumIntake
- The modeled amount of sodium consumed.
- MedicationDose
- The modeled treatment amount. No clinical unit is declared in this fixture.
- Prior, mu, sigma, obs
- Prior is uncertainty before entered evidence; mu is the mean, sigma the standard deviation (spread), and obs an observation.
When to use it
Explore how medication dose and baseline pressure influence follow-up blood pressure.
Applications
- Process engineering: estimate an output and compare a controlled input setting.
- Sensor systems: combine noisy measurements while tracking uncertainty in the estimated state.
Why it matters
A fitted relationship becomes decision-relevant only after you state the linear Gaussian assumptions and distinguish an observation from a modeled intervention.
Questions you can ask
- What pressure does the model predict from the observed dose and baseline?
- How does the expected pressure change when dose is set to a different value?
- For this factual case, what pressure would the model predict under a different dose?
Causal boundary
Supports interventions under the model’s declared structural assumptions.
Counterfactual queries additionally rely on the declared shared-noise model. These answers do not establish that the supplied causal assumptions hold in the real world.
Profile and resource limits
Linear mechanisms and Gaussian noise; these assumptions do not describe arbitrary nonlinear responses.
Online uses protected execution with plan and request limits. Check the returned method, exactness, and resource diagnostics for each query.
Existing workspace example
Hypertension Treatment Pathway
Explore how baseline systolic pressure, sodium intake, and medication dose shape follow-up pressure. Observe a patient profile, intervene on dose, then ask the same-patient counterfactual.
After signing in, open the workspace example gallery and choose this example. Workspace access and actions follow your plan.
Sign in to explore examplesUse it in your application
Released through the native engine and host software development kits (SDKs). Online and SDK resource profiles differ; check the documentation bundled with your exact SDK version.
Read SDK guidance and examples