Causal artificial intelligence (AI) · Model guide
Gaussian dynamic models
Gaussian dynamic Bayesian network (Gaussian DBN)
Keep a continuously changing estimate current as noisy measurements arrive, with uncertainty visible at every step.
Track numerical state and uncertainty through linear Gaussian transitions and observations.
Also known as: GaussianDBN, KalmanModel.
The model in pictures
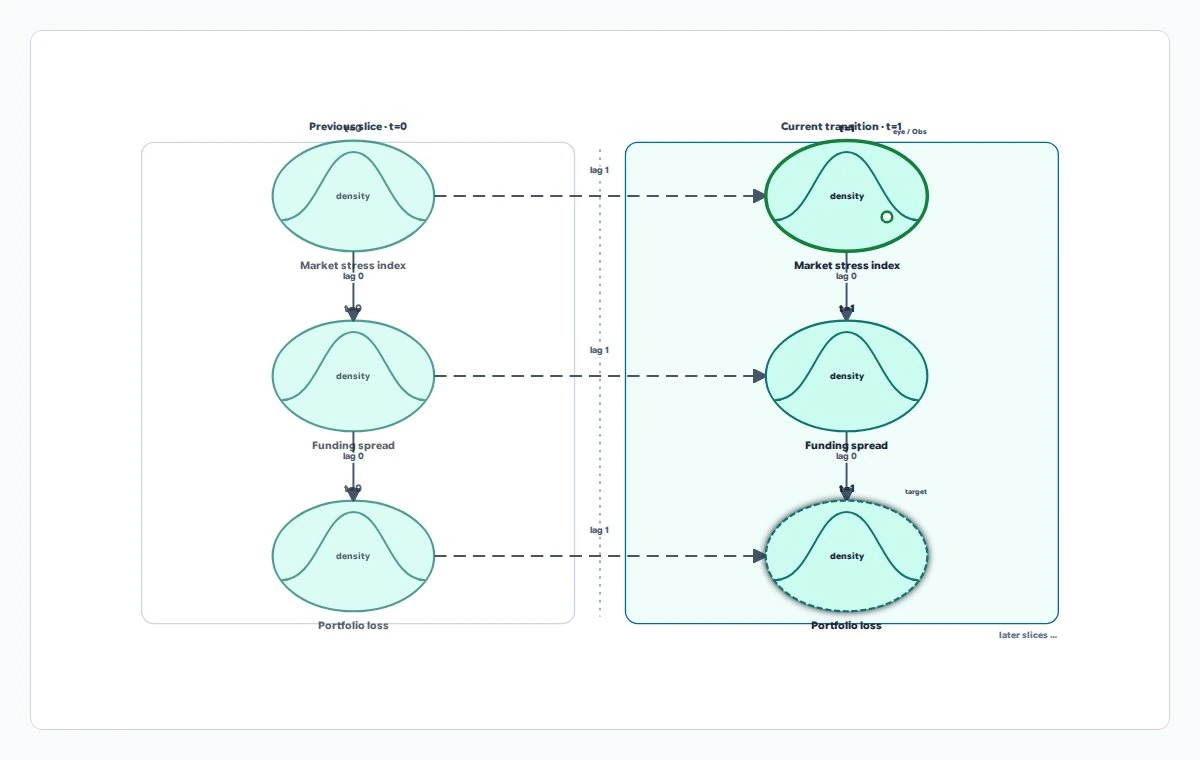
Gaussian dynamic Bayesian network (Gaussian DBN)
A time-based network of numeric quantities with linear relationships and bell-shaped uncertainty. It describes how measurements and their uncertainty evolve together.
How does a market-stress observation change the expected portfolio loss?
The two panels show successive reporting periods. Horizontal dashed arrows carry values between periods; vertical arrows connect quantities in one period. The curves denote numeric uncertainty, not price-history charts.
Synthetic example, not real patient, customer or operational data.
Variables and symbols
- Market stress index
- A standardized stress measure in z-score units, or standard deviations from a reference mean.
- Funding spread
- A borrowing-cost spread in basis points (bps); one basis point is 0.01 percentage point.
- Portfolio loss
- The modeled loss expressed as a percentage.
- t, lag, Obs
- t is the reporting period; lag 0 is within a period and lag 1 is between periods. Obs means observation.
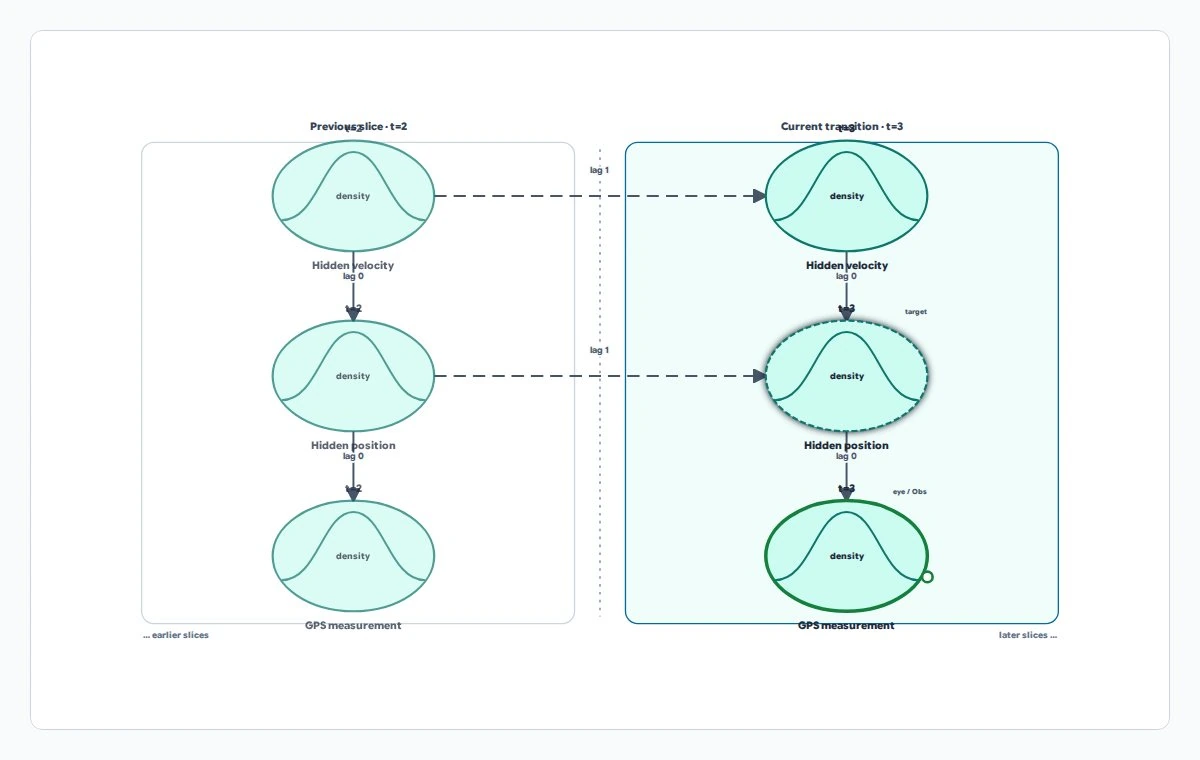
Kalman state-space model
A linear model that separates a changing hidden state from noisy measurements of it. Kalman filtering combines the motion assumptions and incoming measurements to estimate that state.
Where is the vehicle likely to be when its position sensor is noisy?
Two time panels distinguish hidden velocity and position from the observed sensor reading. Curves represent Gaussian, or bell-shaped, uncertainty. A highlighted measurement is input evidence, while the marked position node is the estimation target.
Synthetic example, not real patient, customer or operational data.
Variables and symbols
- Hidden velocity
- The vehicle's unobserved velocity in meters per second (m/s).
- Hidden position
- The vehicle's unobserved position in meters (m).
- GPS measurement
- A noisy position reading from the Global Positioning System (GPS), in meters.
- t, lag, Obs
- t indexes time steps; lag 0 is within a step and lag 1 is between steps. Obs means observation.
When to use it
Estimate vehicle position and velocity from noisy sensor readings.
Applications
- Navigation: estimate position and velocity from noisy sensors.
- Operations forecasting: update a changing demand or inventory state as measurements arrive.
Why it matters
A forecast supplies the next-state range; an intervention query tests how a declared control input would change that modeled trajectory.
Questions you can ask
- What position and uncertainty should we forecast next?
- How does the forecast change when a control input is set to a different value?
- Given the measured path, what trajectory would the model predict under a different control input?
Causal boundary
Supports interventions under the model’s declared structural assumptions.
Counterfactual queries additionally rely on the declared shared-noise model. These answers do not establish that the supplied causal assumptions hold in the real world.
Profile and resource limits
Linear Gaussian dynamics with bounded state dimension and horizon. Kalman state-space models are a profile, not another family.
Online uses protected execution with plan and request limits. Check the returned method, exactness, and resource diagnostics for each query.
Existing workspace example
Liquidity Stress Forecast
Forecast portfolio loss as market stress propagates through funding spreads over reporting periods. Add numeric evidence to see the downstream mean and uncertainty change.
After signing in, open the workspace example gallery and choose this example. Workspace access and actions follow your plan.
Sign in to explore examplesUse it in your application
Released through the native engine and host software development kits (SDKs). Online and SDK resource profiles differ; check the documentation bundled with your exact SDK version.
Read SDK guidance and examples