Causal artificial intelligence (AI) · Model guide
Conditional linear Gaussian models
Conditional linear Gaussian (CLG) model
Compare numerical outcomes without pretending that every category follows the same response curve.
Let categorical regimes select linear Gaussian relationships for continuous measurements.
Also known as: CLG.
The model in pictures
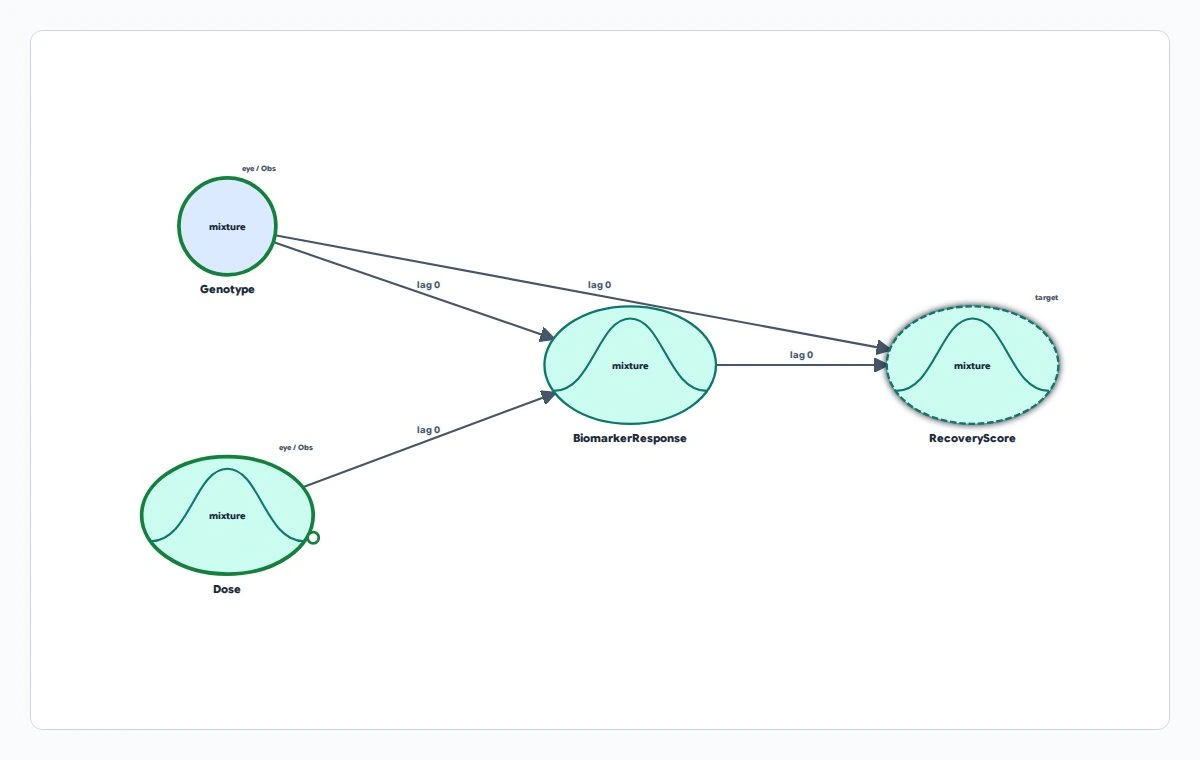
Conditional linear Gaussian (CLG) model
A model combining categories and numeric quantities. Each category selects a linear relationship with Gaussian, or bell-shaped, uncertainty for the numeric part.
How does the expected response to a dose differ between genotype categories?
The genotype circle is categorical; the curved ovals are numeric. Together genotype and dose inform biomarker response, which informs recovery. Mixture means combining category-specific numeric distributions, not mixing treatments.
Synthetic example, not real patient, customer or operational data.
Variables and symbols
- Genotype
- The categorical genetic response group, including the observed variant state.
- Dose
- The modeled treatment amount.
- BiomarkerResponse
- A numeric change in the biological marker used by this example.
- RecoveryScore
- A numeric outcome score. These example quantities do not establish clinical scales or thresholds.
- Obs and lag 0
- Obs means observation; lag 0 indicates a relationship within the same modeled moment.
When to use it
Model how genotype changes a treatment-response curve.
Applications
- Manufacturing: model a measurement under distinct machine or material regimes.
- Risk modeling: compare continuous exposure distributions across declared customer or operating categories.
Why it matters
Regime-specific predictions show where one average hides meaningful differences, and causal modes test a modeled setting change under the supplied structure.
Questions you can ask
- How does a biomarker distribution change across observed genotype groups?
- How does the modeled biomarker distribution change when treatment is set?
- For this factual case, what response would the model predict under a different treatment setting?
Causal boundary
Supports interventions under the model’s declared structural assumptions.
Counterfactual queries additionally rely on the declared shared-noise model. These answers do not establish that the supplied causal assumptions hold in the real world.
Profile and resource limits
Discrete regime combinations can grow quickly; exact mixtures and approximate methods have separate limits and diagnostics.
Online uses protected execution with plan and request limits. Check the returned method, exactness, and resource diagnostics for each query.
Existing workspace example
Genotype-Aware Treatment Response
Use genotype as a discrete response regime while dose, biomarker response, and recovery remain continuous. Compare exact mixture inference with Rao-Blackwellized approximation.
After signing in, open the workspace example gallery and choose this example. Workspace access and actions follow your plan.
Sign in to explore examplesUse it in your application
Released through the native engine and host software development kits (SDKs). Online and SDK resource profiles differ; check the documentation bundled with your exact SDK version.
Read SDK guidance and examples