Causal artificial intelligence (AI) · Model guide
Discrete Bayesian networks
Bayesian belief network (BBN)
Separate what you observed from what could change under a decision, so a treatment, policy, or operational choice is not mistaken for a correlation.
Combine labeled states and conditional probability tables to reason about uncertain outcomes.
Also known as: BBN, BayesianNetwork.
The model in pictures
Bayesian belief network (BBN)
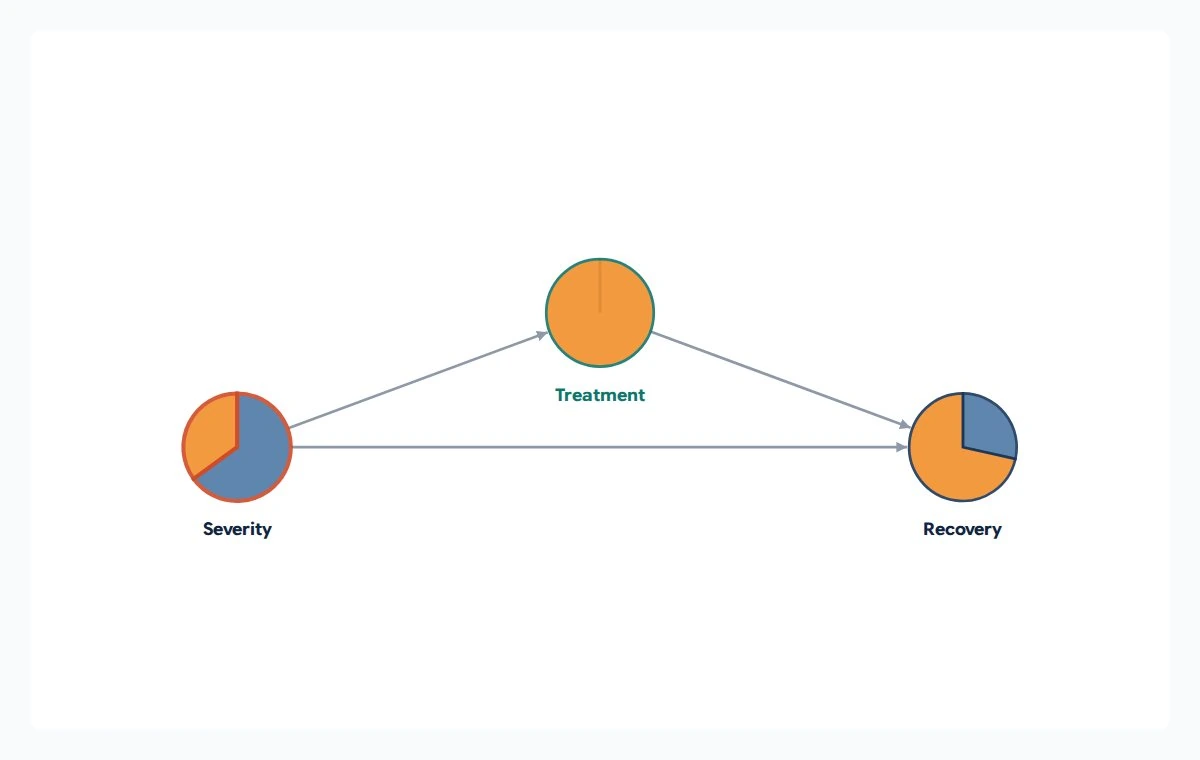
A network of uncertain variables that updates their probabilities when you learn something new. This example separates a treatment's apparent association with recovery from its effect under stated causal assumptions.
Does recovery differ because of treatment, or because the treated patients started out sicker?
The circles are variables; their slices show probabilities of the possible states. Arrows encode this example's assumptions: severity matters for both treatment assignment and recovery. Treatment is fixed to treated in the pictured scenario.
Synthetic example, not real patient, customer or operational data.
Variables and symbols
- Severity
- How ill the patient is before treatment: mild or severe.
- Treatment
- Whether the patient is in the control or treated group.
- Recovery
- Whether recovery occurs: no or yes.
Influence diagram (ID)
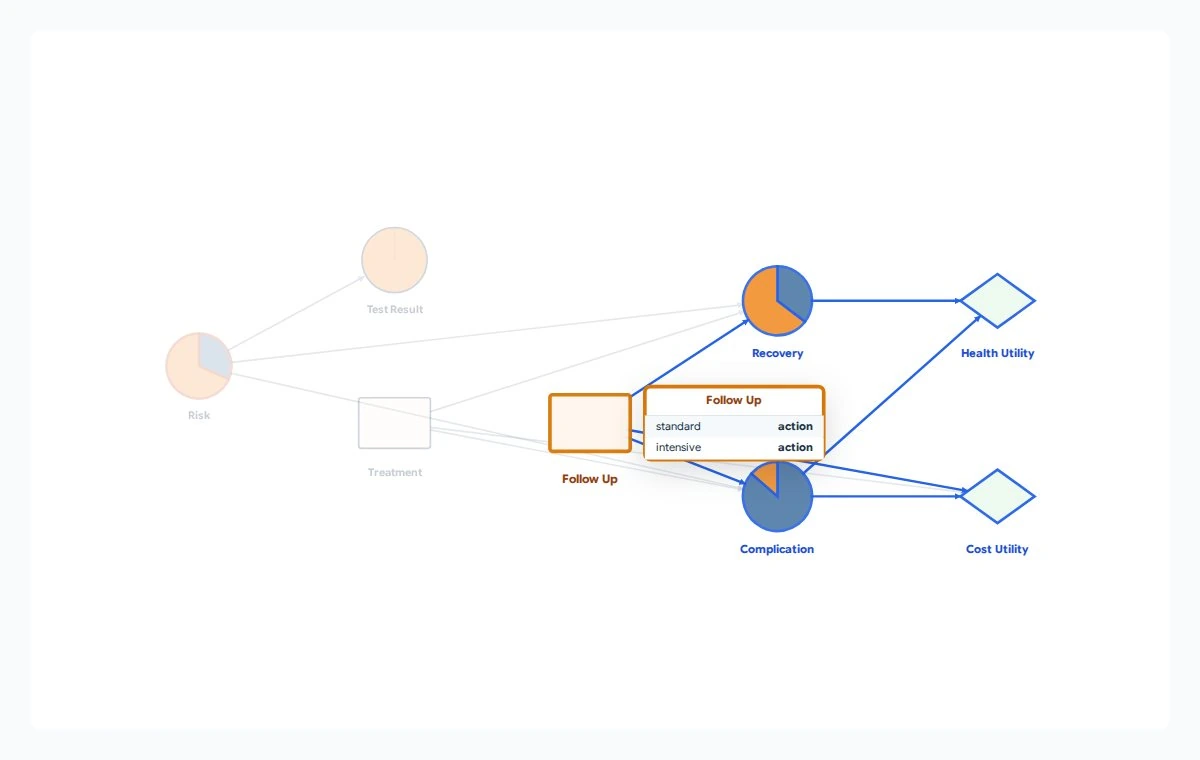
A probability network extended with choices and scores for their consequences. It represents what is uncertain, what can be decided, and what outcomes are valued.
Which treatment and follow-up choices balance recovery, complications and cost under the model's assumptions?
Circles represent uncertain events, rectangles represent decisions, and diamonds represent utility scores. The highlighted follow-up stage shows its available choices and downstream outcomes, not a recommended care plan.
Synthetic example, not real patient, customer or operational data.
Variables and symbols
- Risk and Test Result
- Baseline risk is low or high; the diagnostic result is negative or positive.
- Treatment and Follow Up
- Decisions to monitor or treat, and to provide standard or intensive follow-up.
- Recovery and Complication
- Outcomes: poor or good recovery, and no or serious complication.
- Health Utility and Cost Utility
- Model-defined scores for health outcomes and cost. Utility is a preference score, not a probability.
When to use it
Compare recovery prospects for patients with different baseline severity.
Applications
- Manufacturing: compare defect risk under an observed process setting with risk under a controlled setting change.
- Service operations: update incident risk from observed signals, then compare a proposed response.
- Care-pathway modeling: distinguish observed treatment selection from an intervention under explicitly declared assumptions.
Why it matters
The same recovery prediction can move when treatment is observed versus deliberately set; the difference shows why a forecast alone is not a decision.
Questions you can ask
- Among cases where treatment was observed, what is the modeled probability of recovery?
- What is the modeled probability of recovery if treatment is set to treated?
- Given the factual case, what would the model predict under a different treatment action?
Causal boundary
Supports interventions under the model’s declared structural assumptions.
Counterfactual queries additionally rely on the declared shared-noise model. These answers do not establish that the supplied causal assumptions hold in the real world.
Profile and resource limits
Finite states and acyclic graphs; exact work grows with factor size. Counterfactuals require the declared structural noise convention.
Online uses protected execution with plan and request limits. Check the returned method, exactness, and resource diagnostics for each query.
Existing workspace example
Treatment Effect with Severity Confounding
Explore how baseline severity affects both treatment assignment and recovery in a compact discrete Bayesian network. Compare the observational association with an intervention on treatment, then edit the graph, states, and conditional probability tables.
After signing in, open the workspace example gallery and choose this example. Workspace access and actions follow your plan.
Sign in to explore examplesUse it in your application
Released through the native engine and host software development kits (SDKs). Online and SDK resource profiles differ; check the documentation bundled with your exact SDK version.
Read SDK guidance and examples